A skin study can produce a precise number while leaving a practical question open. The useful first step is to complete the sentence around that number: what was measured, in which samples, compared with what, and after how long? Those details determine whether two figures belong beside each other. They also help explain why a striking graph and a cautious conclusion can be entirely consistent.
This guide follows that reading process from laboratory measurements to questions about appearance and care. The arithmetic examples below use invented values, not additional patient results. Their purpose is to make the reasoning inspectable: a reader should be able to reproduce a calculation, identify its denominator, and see where a new measurement would be needed before making a broader claim.
Study figure and data
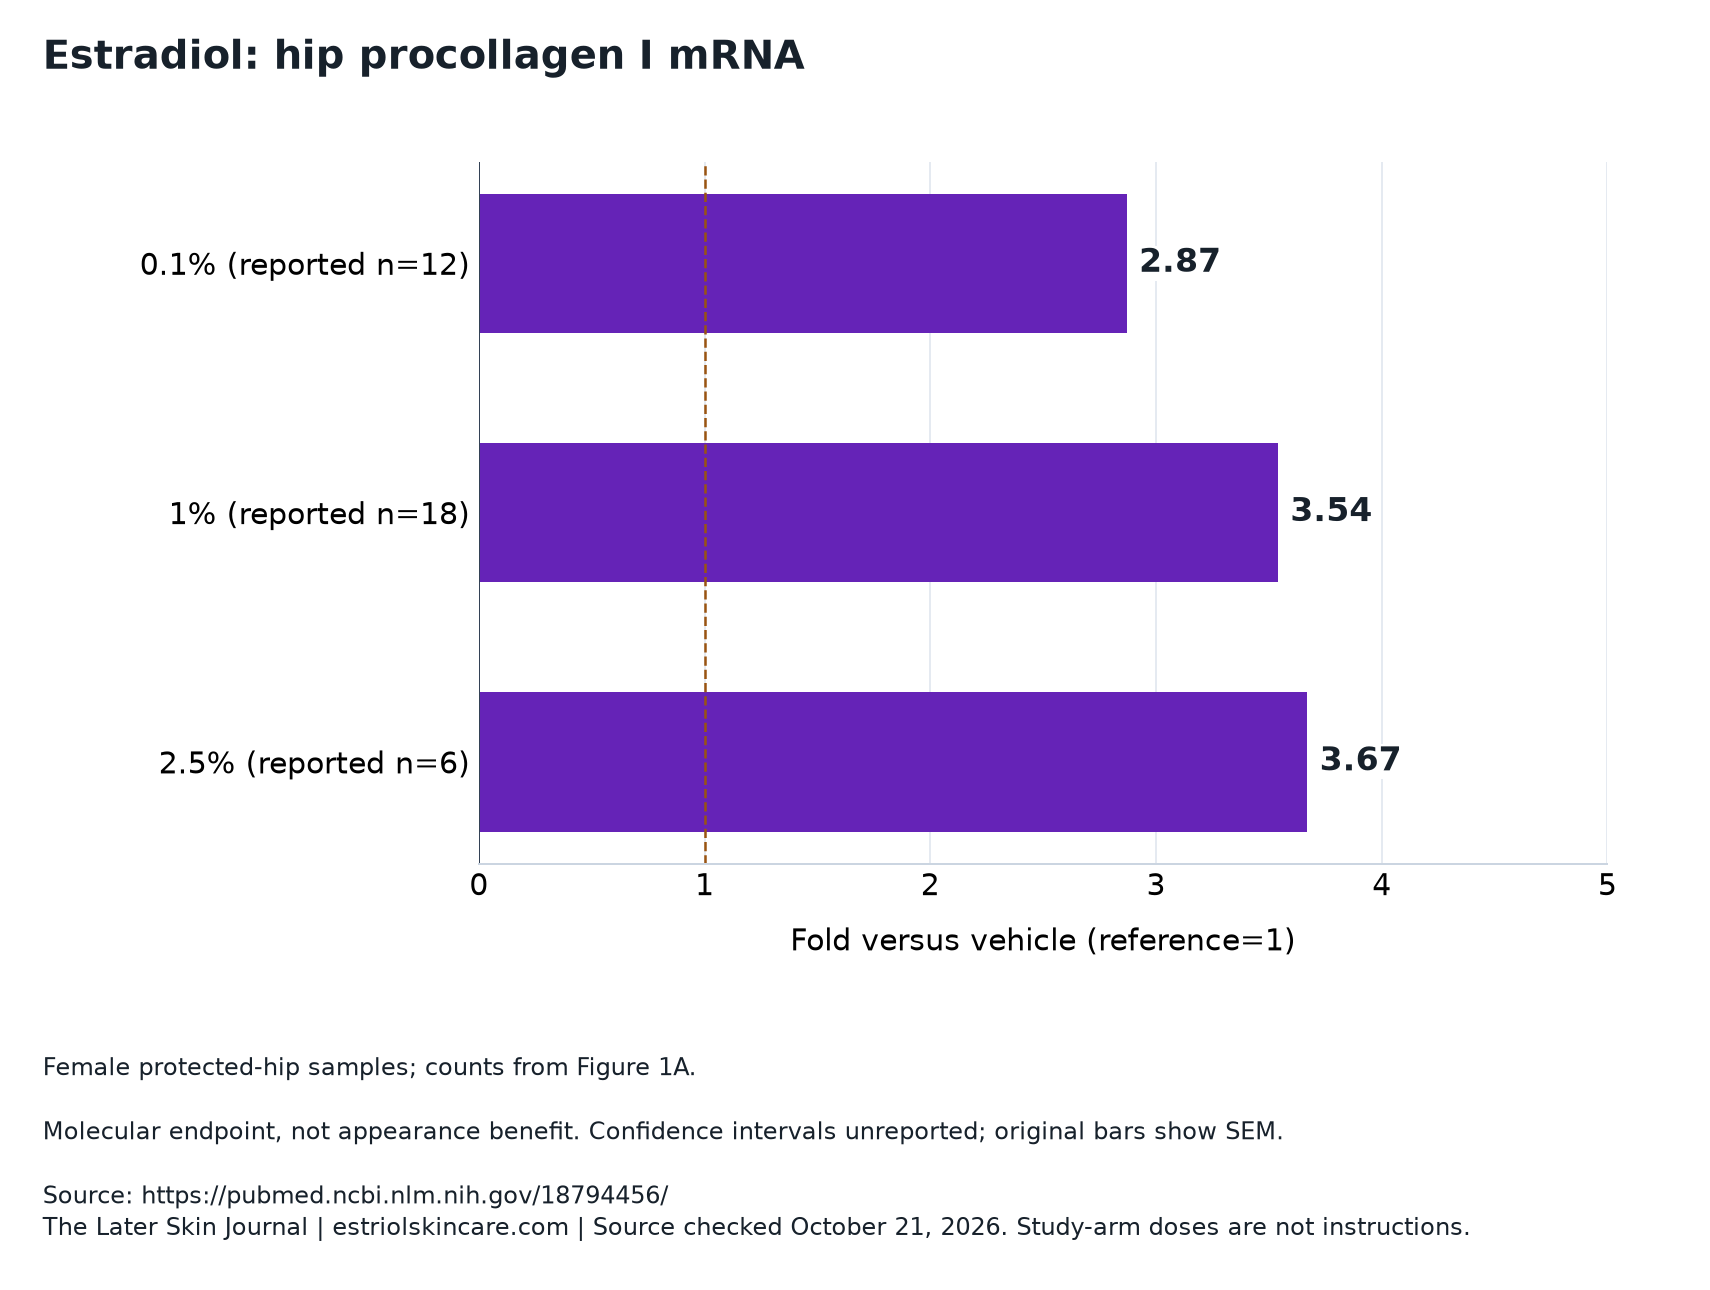
Estradiol: hip procollagen I mRNA
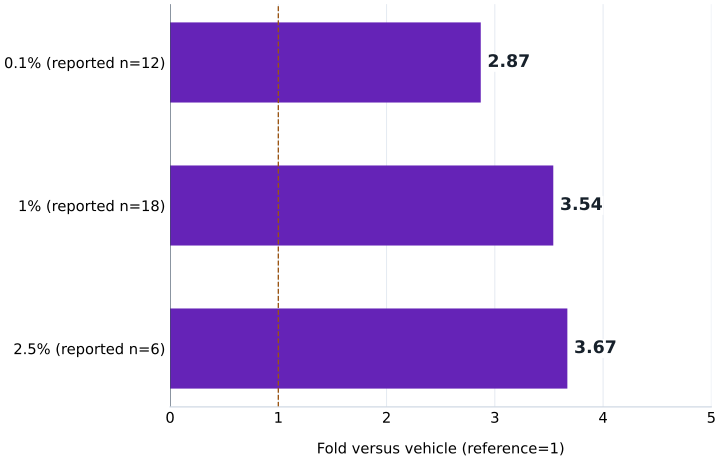
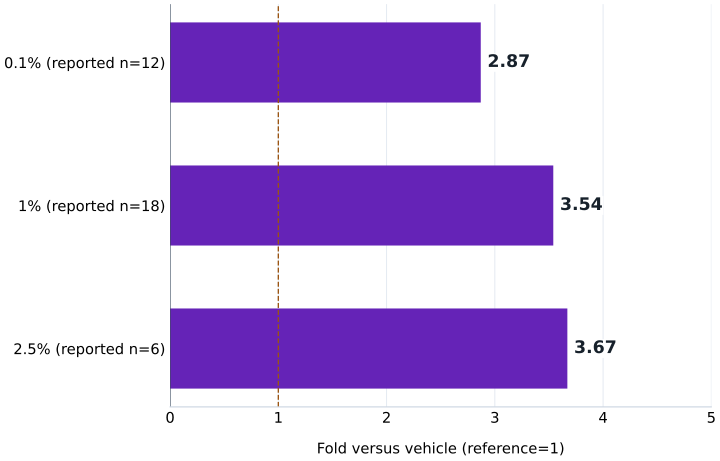
Female protected-hip samples; counts from Figure 1A.
Molecular endpoint, not appearance benefit. Confidence intervals unreported; original bars show SEM.
Download chart (PNG)Download data (CSV)Download vector chart (SVG)
| Historical estradiol concentration | Reported value |
|---|---|
| 0.1% (reported n=12) | 2.87 |
| 1% (reported n=18) | 3.54 |
| 2.5% (reported n=6) | 3.67 |
Begin with the measured quantity
COL1A1 denotes the plotted procollagen I messenger RNA. Think of a measurement name as the subject of a sentence, not a decoration that can be removed for a shorter headline. If the subject changes midway through the explanation, the conclusion may have changed too. A useful reading exercise is to copy the measurement into one column and the desired everyday outcome into another. Leave a third column for the evidence connecting them.
For example, suppose an invented laboratory report measures a transcript, a protein assay and a photograph rating. Give each a separate row even if all three are discussed under the same broad topic. Do not convert the transcript row into the protein row by changing its label. Likewise, a photograph score needs its own defined assessment procedure. This is an editorial rule for keeping different observations visible, rather than a claim that one particular measurement is always the best.
The research-reading guide offers a broader starting point. Here, concentrate on the question each measurement could answer directly. A complete explanation should preserve that question when it moves from the laboratory methods to the graph caption and finally to the article headline.
Reconstruct the comparison before reading the bars
The 2008 experiments involved 70 volunteers averaging about 75: one-week paired hip/forearm vehicle comparisons; two-week facial pre/post testing (five women/five men). Randomization is unestablished. Facial/forearm procollagen changes were nonsignificant. Estrogen-response marker GREB1 increased across sites.
A design sketch is often clearer than a single enrollment number. Draw one box for each comparison, then put the relevant sample, observation time and reference condition inside it. Two boxes should remain separate when their comparisons differ. The question answered by a change within a person over time is not identical to the question answered by two conditions observed alongside each other. That distinction is present before any statistical calculation begins.
For an invented paired experiment, imagine that each person contributes two measurements, one under condition A and one under condition B. Compare A with B within each person before summarizing those comparisons. This preserves which observations belong together. An entirely different exercise would compare a group measured in January with another group measured in June. Similar labels or an identical total number of observations would not make those designs interchangeable. The study map is therefore part of the result, rather than background to skip.
Keep the denominator beside the ratio
A ratio is a division, so both sides of the division matter. In an invented example, a reading of 18 divided by a reference reading of 6 equals 3. That is three times the reference. The increase above the reference is 12, which is twice the reference, or a 200% increase. Saying “three times” and “300% more” would describe different calculations. Neither calculation supplies the original measurement unit unless that unit is also reported.
Now change the invented reference to 9 while keeping the other reading at 18. The ratio becomes 2. Nothing happened to the numerator; the comparison changed. This is why extracting a ratio without its reference can make an unchanged measurement appear to have a different meaning. Ratios can be useful, but they do not relieve readers of checking what was divided by what.
The table is arithmetic practice, not an estimate of any treatment effect. It deliberately includes two rows with the same ratio and different absolute differences. The guide to concentration labels addresses another place where a percentage needs its full description. In either setting, write the calculation in words before comparing numbers.
| Reading and reference | Ratio calculation | Difference above reference |
|---|---|---|
| 18 and 6 | 18 ÷ 6 = 3 | 12 units; 200% |
| 18 and 9 | 18 ÷ 9 = 2 | 9 units; 100% |
| 6 and 2 | 6 ÷ 2 = 3 | 4 units; 200% |
Choose the summary before averaging
Even a correctly calculated ratio leaves a second question: how were several ratios combined? Consider two invented pairs. Person A has readings of 10 and 5, giving a ratio of 2. Person B has readings of 90 and 30, giving a ratio of 3. The simple average of the two individual ratios is 2.5. Dividing the total of the first readings by the total of the references gives 100 divided by 35, approximately 2.86.
Neither arithmetic operation is a transcription error. They summarize different things. The first gives the two people equal weight in the average of their ratios. The second combines the readings before dividing. An article that changes from one operation to the other without saying so changes the numerical question. These invented results are not a reconstruction of the published study or its analysis.
Use this example as a reason to look for an explicit summary definition, rather than as a reason to choose whichever calculation looks more favorable. If the available report does not explain that detail, preserve the uncertainty. The estriol and estradiol comparison is useful for keeping ingredient questions separate while you check how each research result was summarized.
Separate variability from uncertainty about a summary
An error bar should come with a name. A standard deviation describes spread among observations; a standard error describes uncertainty associated with an estimated summary under its statistical assumptions. A confidence interval presents a range calculated using a stated procedure and confidence level. Those descriptions are not interchangeable. Reading an unnamed bar as the range containing nearly everyone would add a claim that its label may never have made.
For a deliberately simple invented example, take four independent observations with a standard deviation of 8 units. The elementary standard error of their mean is 8 divided by the square root of 4, or 4 units. With 16 independent observations and the same standard deviation, that calculation gives 2 units. The underlying spread in this exercise stays at 8; the uncertainty measure changes. Real paired or transformed analyses may require different calculations.
Do not reverse this classroom example to manufacture missing intervals from a published picture. The analysis, sample definition and relevant degrees of freedom must be known. When comparing graphs, first transcribe the error-bar label, then decide whether their uncertainty displays answer the same question. A small-looking bar is not a substitute for that description.
Translate between instruments and judgments carefully
The 1996 indexed abstract describes 59 preclimacteric women, two active compounds over six months, corneometry, profilometry and ten biopsies. Type III labeling increased; prolactin also increased. Randomization, blinding and vehicle control are unestablished; funding is unknown. The 2026 Alloy-funded conference pilot instead randomized 90 women aged 50–60 for 12 weeks. Its primary investigator ratings and physical measurements are distinct. Water-loss instrumentation and a TEWL protocol are unspecified. General scale anchors are 0=none and 4=severe; item-specific anchors, validation and aggregation are unreported.
These differences suggest a practical reading worksheet. For every endpoint, record the observation method, unit or scale, assessor and timing. Do not fill an empty field using a different paper simply because the studies discuss related skin concerns. A method described elsewhere is a possible method, not evidence that the current researchers used it.
The companion article on hydration measurements develops this distinction further. As an original example, imagine a device reading of 42 arbitrary units beside an observer score of 2. Both can be recorded honestly, but subtracting one from the other is meaningless. They need separate interpretations before a reader can consider whether their patterns tell a coherent story.
Leave inconsistencies visible in the record
Figure 1A’s female n=18 conflicts with Table 1’s 17; Figure 1B’s first protein dose, 0.01%, conflicts with narrative 0.1%.
A useful editorial response has three parts: identify the locations that disagree, state the unresolved difference, and keep it from silently changing another result. Do not average two conflicting labels or choose the one that makes the surrounding story easier. A discrepancy is a reason to narrow the claim, not permission to invent the missing explanation. It also does not establish that every other number in a paper is wrong.
For an invented example, suppose a table calls a measurement “after four visits,” while a caption says “after five.” A reader can preserve both labels and request clarification without pretending to know which visit was omitted. The same discipline applies to participant counts: several measurements need not represent several different people. Before adding counts, look for a clear statement that the groups are distinct and that the same people were not measured repeatedly.
Record the uncertainty where the number is used. A distant general disclaimer is less useful than a short note attached to the relevant comparison. This makes it possible for another reader to follow the same calculation and see exactly which unresolved detail limits it.
Give exposure and safety their own questions
Facial 0.2% research estradiol raised serum levels 12-fold/2-fold (women/men). Pfizer partly funded research; Voorhees disclosed Pfizer consulting. The 1993 indexed abstract followed 17 women using facial estrogen ointments for three months; serum hormones and vaginal smears showed no significant change. Randomization, blinding and vehicle control are unestablished; funding is unknown.
A safety question needs an outcome and an observation window, just as an effectiveness question does. In an invented planning exercise, one study records discomfort at scheduled visits while another seeks a specific laboratory change. The resulting observations cannot be substituted for each other. A third question about uncommon events over several years would require a different investigation. Listing these questions separately is more informative than assigning one broad safety label.
The historical preparation, body site and measurement schedule belong with an exposure result. Keeping them attached prevents an accidental jump to another formula or dispensing arrangement. Likewise, a nonsignificant comparison does not establish an exact zero. The safety discussion guide helps organize questions for a clinician; it should not be read as a personalized instruction to begin, stop or alter treatment. Funding disclosures belong in the same reading record, without being treated as either automatic disproof or automatic reassurance.
Ask what would connect the observation to your goal
An informative next question often begins with “what else would need to be measured?” Suppose an invented experiment reports a laboratory difference and a reader wants to know about visible texture. Write that desired outcome explicitly, then ask how it would be assessed, by whom, at what time and against which comparison. This exposes the missing link without requiring the reader to reject the laboratory finding.
A body-site difference is also an observation before it is an explanation. To ask why two places differed, a research plan would need to address competing explanations and specify what evidence could distinguish them. Listing a plausible explanation is only the start of that process. The same logic applies when a measured response is present but the desired practical outcome has not been assessed.
The table below is an editorial planning aid, not a description of a completed experiment. It keeps several possible goals apart. Choose the row closest to the question you actually care about, then look for evidence that measures it directly. Combining all the rows into one broad claim would remove the very distinctions needed to judge whether that claim is supported.
| Question to answer | Measurement to specify | Comparison to preserve |
|---|---|---|
| Is the laboratory finding repeatable? | The same defined assay and sampling conditions | A suitable reference observed on the same schedule |
| Is appearance different? | A stated assessment method and meaningful threshold | The relevant treatment and comparison conditions |
| Does a person notice a useful change? | A defined participant assessment | The same question and timing in each group |
| What happens with longer exposure? | Named outcomes and duration of follow-up | A design suited to those outcomes |
Keep research interpretation separate from an offer
FDA reports no approved estriol-containing drug. Compounded medicines lack FDA approval and differ from approved generics; registration of a facility is not product approval. These regulatory facts answer a different question from the arithmetic in a laboratory figure.
Our editorial approach is to give an offer its own documentary checklist: ingredient identity, preparation description, dispensing source, consultation terms, renewal process and the evidence cited for each claim. A shared ingredient name is a reason to investigate the connection, not a completed match between a research preparation and a product. The CoreAge Rx offer review and Alloy offer review are places to inspect reported terms; neither link assigns the laboratory results to a brand.
This separation can make a clinical conversation more productive. Bring the exact claim that prompted your interest, the outcome you hope to understand, and the part of the evidence that remains uncertain. A clinician can discuss your circumstances while the written record preserves what the study actually measured. No fold-change calculation can substitute for that individual assessment, and a price or convenient ordering process cannot resolve an unanswered scientific question.
Questions about the evidence
Does a threefold ratio mean a 300% increase?
No. In ordinary ratio arithmetic, three times a reference corresponds to an increase of two times that reference, or 200%. Always check whether the wording describes the final level or the amount above the reference. This is a mathematical distinction, not an additional treatment result or an estimate of visible improvement.
Can I compare the tallest bars in different papers?
First check whether the bars measure the same quantity, use the same reference and summarize observations in the same way. Then inspect the populations, timing and uncertainty displays. A visual comparison is useful for generating a question; it is not itself a calculation of which intervention performed better.
Why not combine every participant count into one larger number?
A total is informative only when you know what it counts. Repeated measurements, overlapping groups and separate experimental questions need to remain identifiable. Before adding numbers, establish that the observations represent distinct people and that combining them serves a defined analysis. Otherwise the new total can make the evidence look more extensive than the relevant comparison.
Does a nonsignificant result establish that nothing happened?
It does not establish an exact zero or prove equivalence. Read the estimate, its uncertainty and the question the statistical test addressed. If those details are incomplete, say what remains unknown rather than replacing the result with a stronger conclusion. A different outcome or longer observation period is also a different question.
What should I take from a molecular study into an appointment?
Bring a precise question: whether the measured outcome relates to your concern, how closely the research preparation resembles the proposed one, and what evidence addresses the relevant benefits and harms. Keep the paper separate from sales material. The clinician can evaluate your circumstances; the study helps define the discussion without becoming personal prescribing instructions.
Editorial assessment
Our assessment is that the most useful reading habit is to preserve the complete comparison from start to finish. Keep the quantity, denominator, observation schedule and uncertainty together. When moving toward a practical decision, name the additional outcome that would need to be measured instead of quietly substituting it for the laboratory result. The worked examples here are tools for checking reasoning. They do not extend the historical experiments, settle their unresolved reporting differences, or establish a result for a particular retail preparation.
Research access and limitations
The arithmetic examples are educational constructions, not patient observations. They illustrate ways to inspect a calculation; they cannot establish a treatment effect or replace an individual clinical assessment.
THE NOTES BEHIND THIS CHAPTER
Sources and access notes
Sources checked October 21, 2026. Access notes identify the material examined for this article.
- Induction of collagen by estradiol: difference between sun-protected and photodamaged human skin in vivo. ↗
Primary full article: methods, main results, participant table, figure captions, discussion and funding reviewed on publisher site · Checked October 21, 2026
Source-register context ↗ - Treatment of skin aging with topical estrogens. ↗
Indexed primary study abstract · Checked October 21, 2026
Source-register context ↗ - When applied to facial skin, does estrogen ointment have systemic effects? ↗
Indexed primary study abstract · Checked October 21, 2026
Source-register context ↗ - FDA Office of Women’s Health: menopause and estriol approval questions ↗
Official FDA consumer page read directly; brief regulatory summary retained · Checked October 21, 2026
Source-register context ↗ - FDA: Compounding and the FDA—questions and answers ↗
Official FDA questions-and-answers page read directly; concise editorial summary retained · Checked October 21, 2026
Source-register context ↗ - Menopause Society 2026 abstract P-124: pilot study of estriol or estradiol facial cream ↗
Original 2026 conference abstract P-124 and its complete table, PDF page50; text and rendered page reviewed · Checked October 21, 2026
Source-register context ↗